Graphical Analysis
graphical
About App
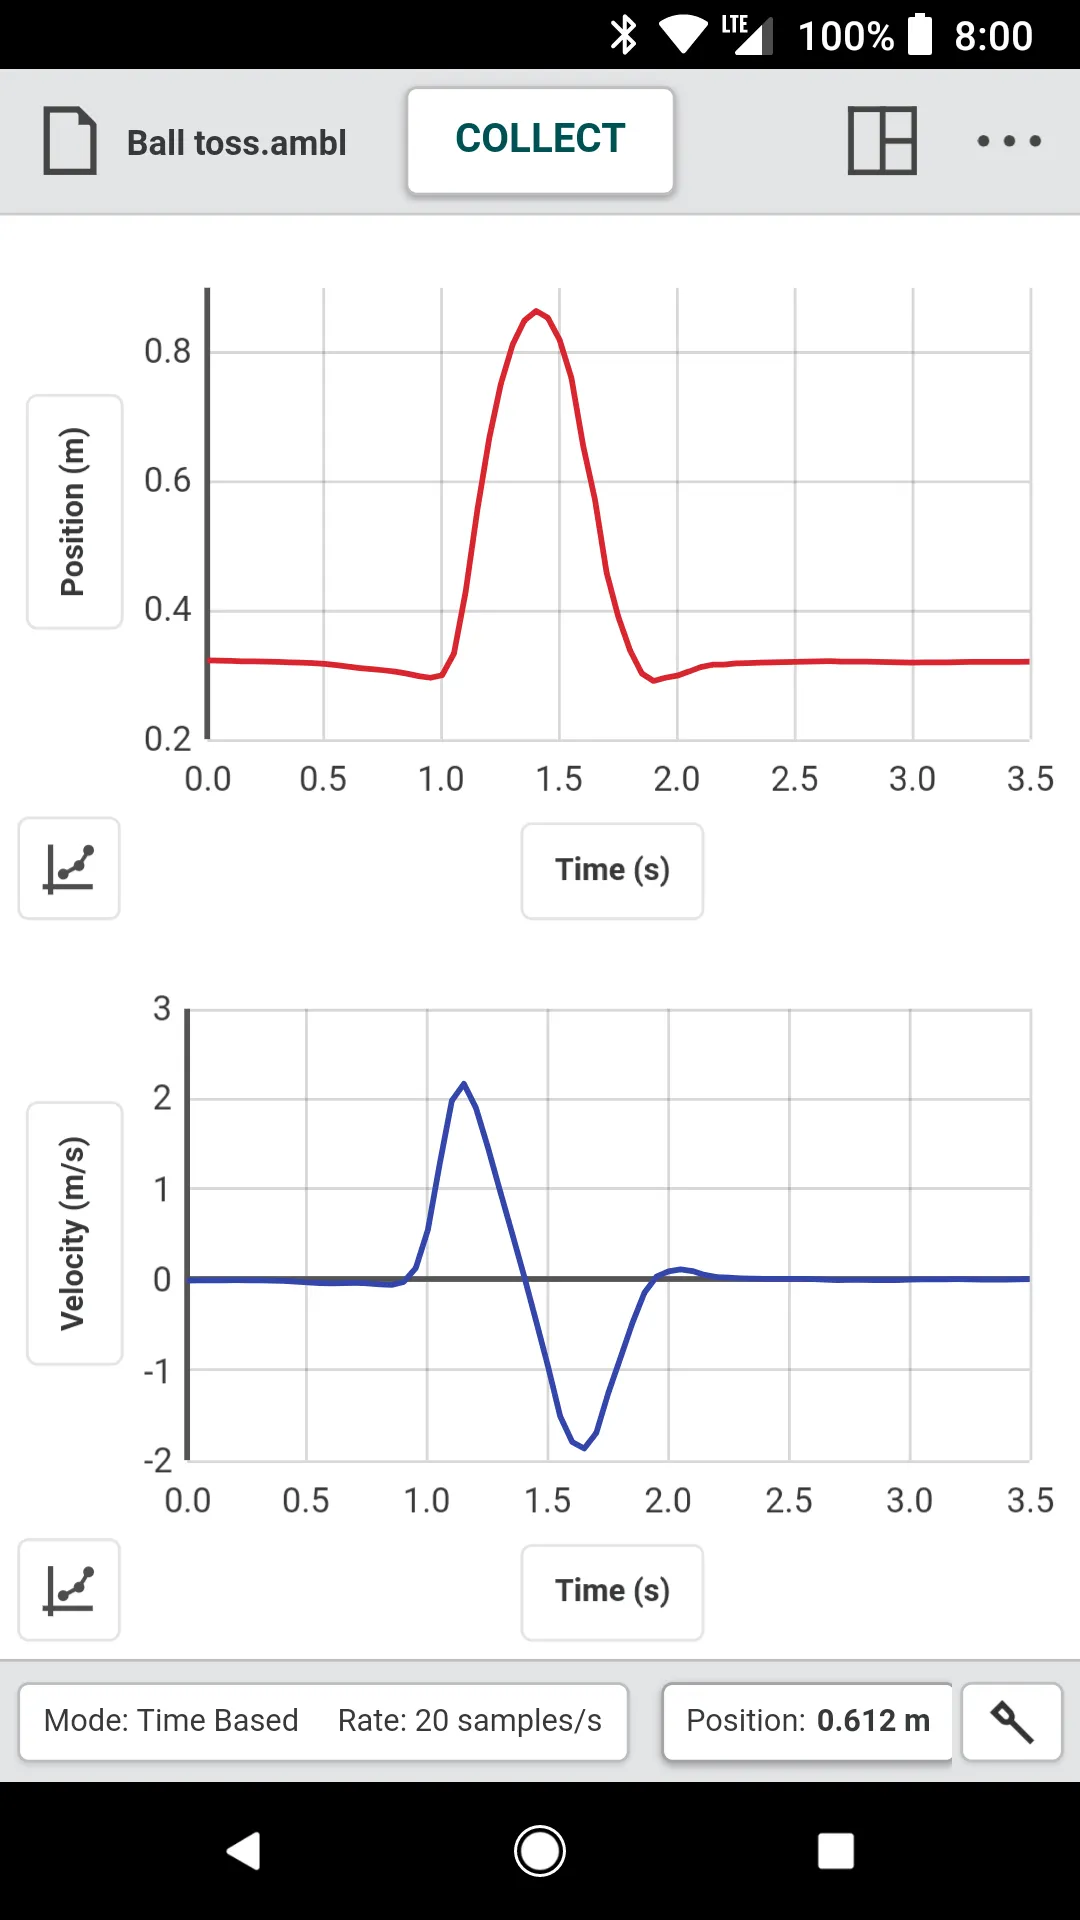
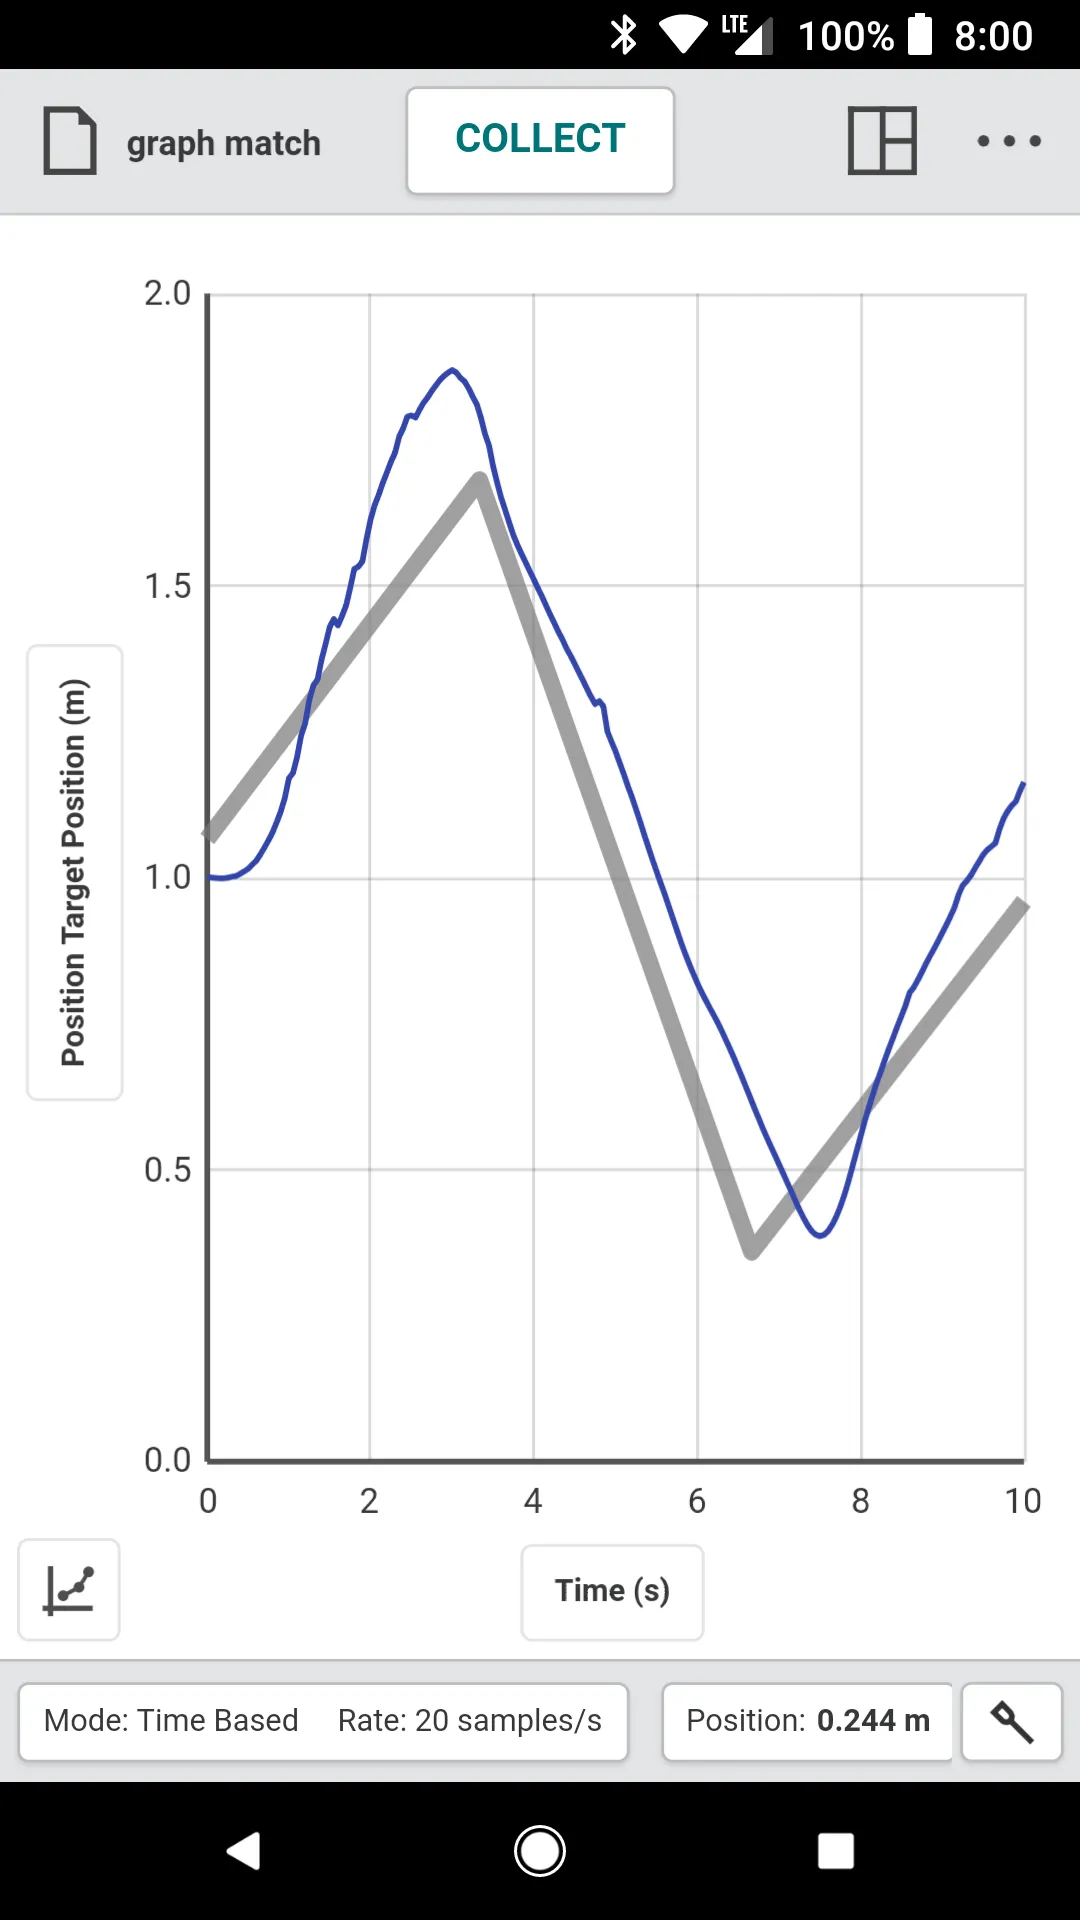
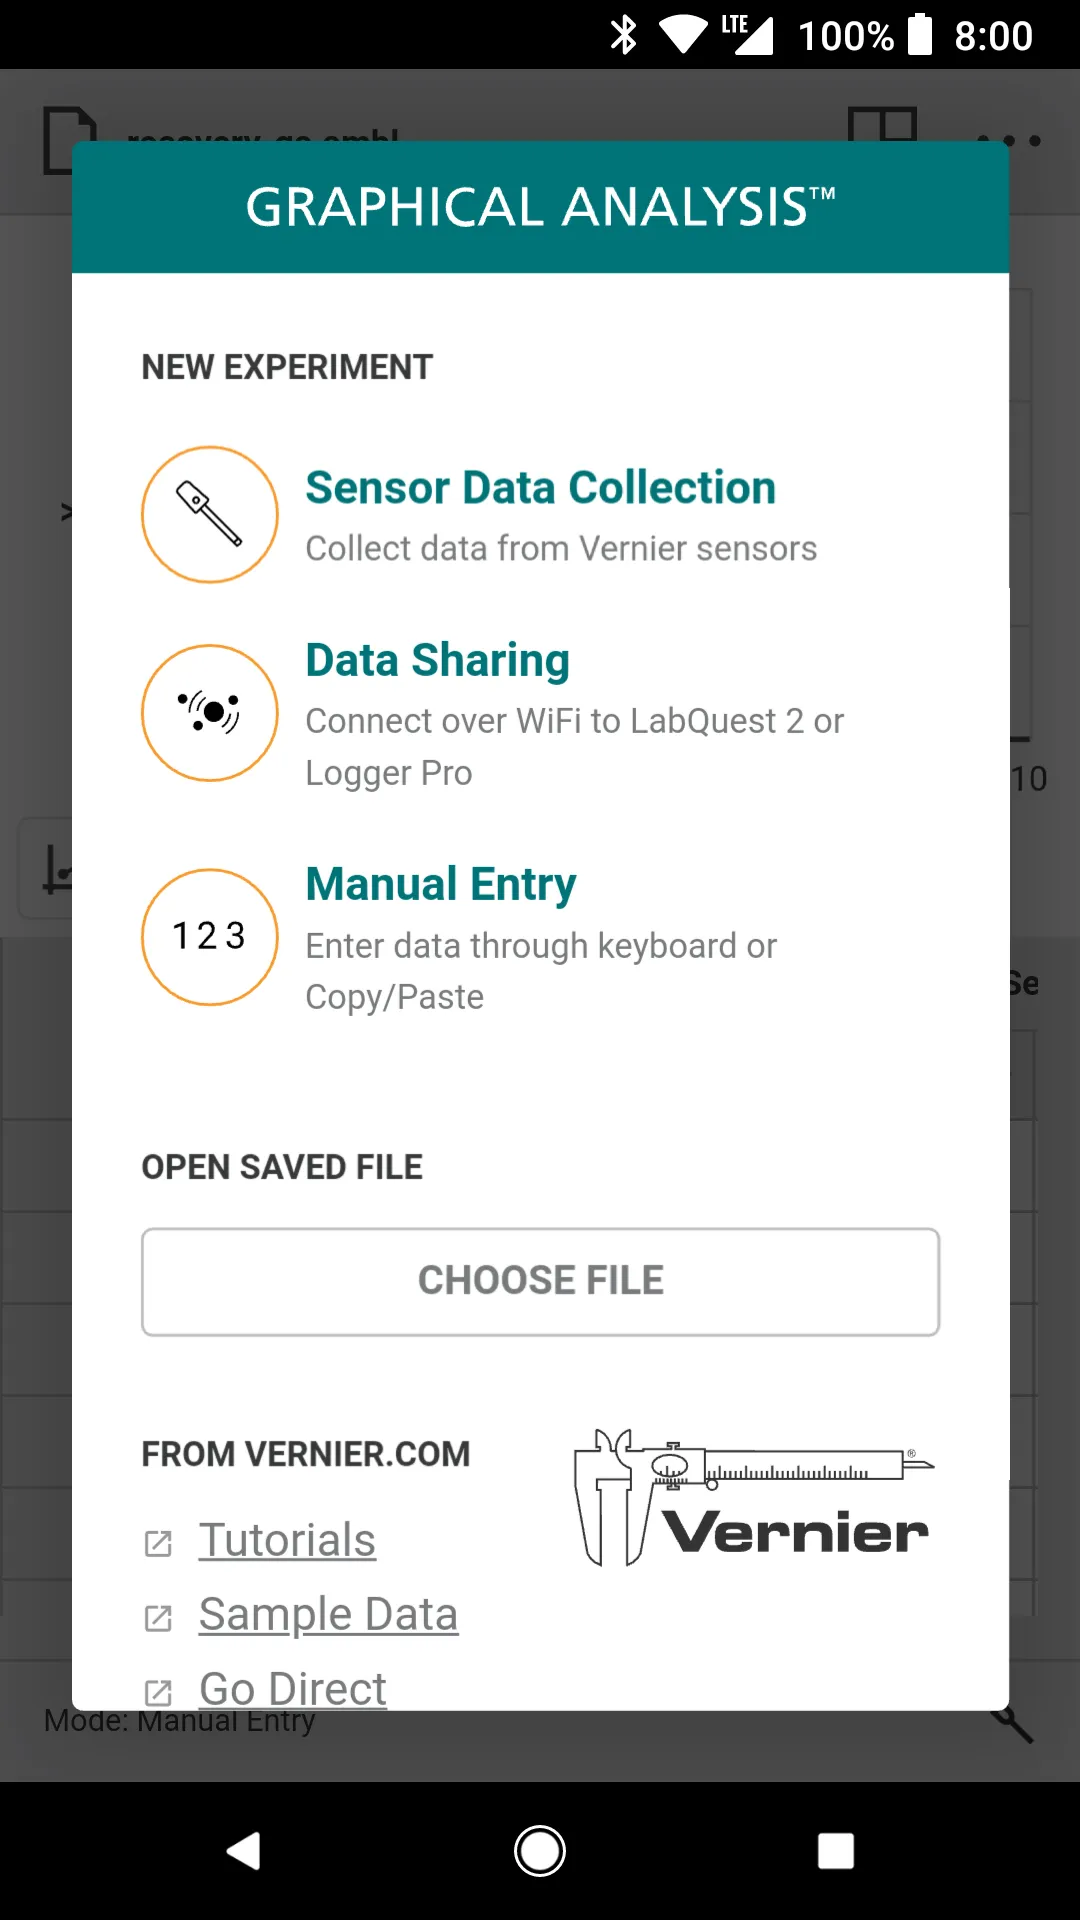
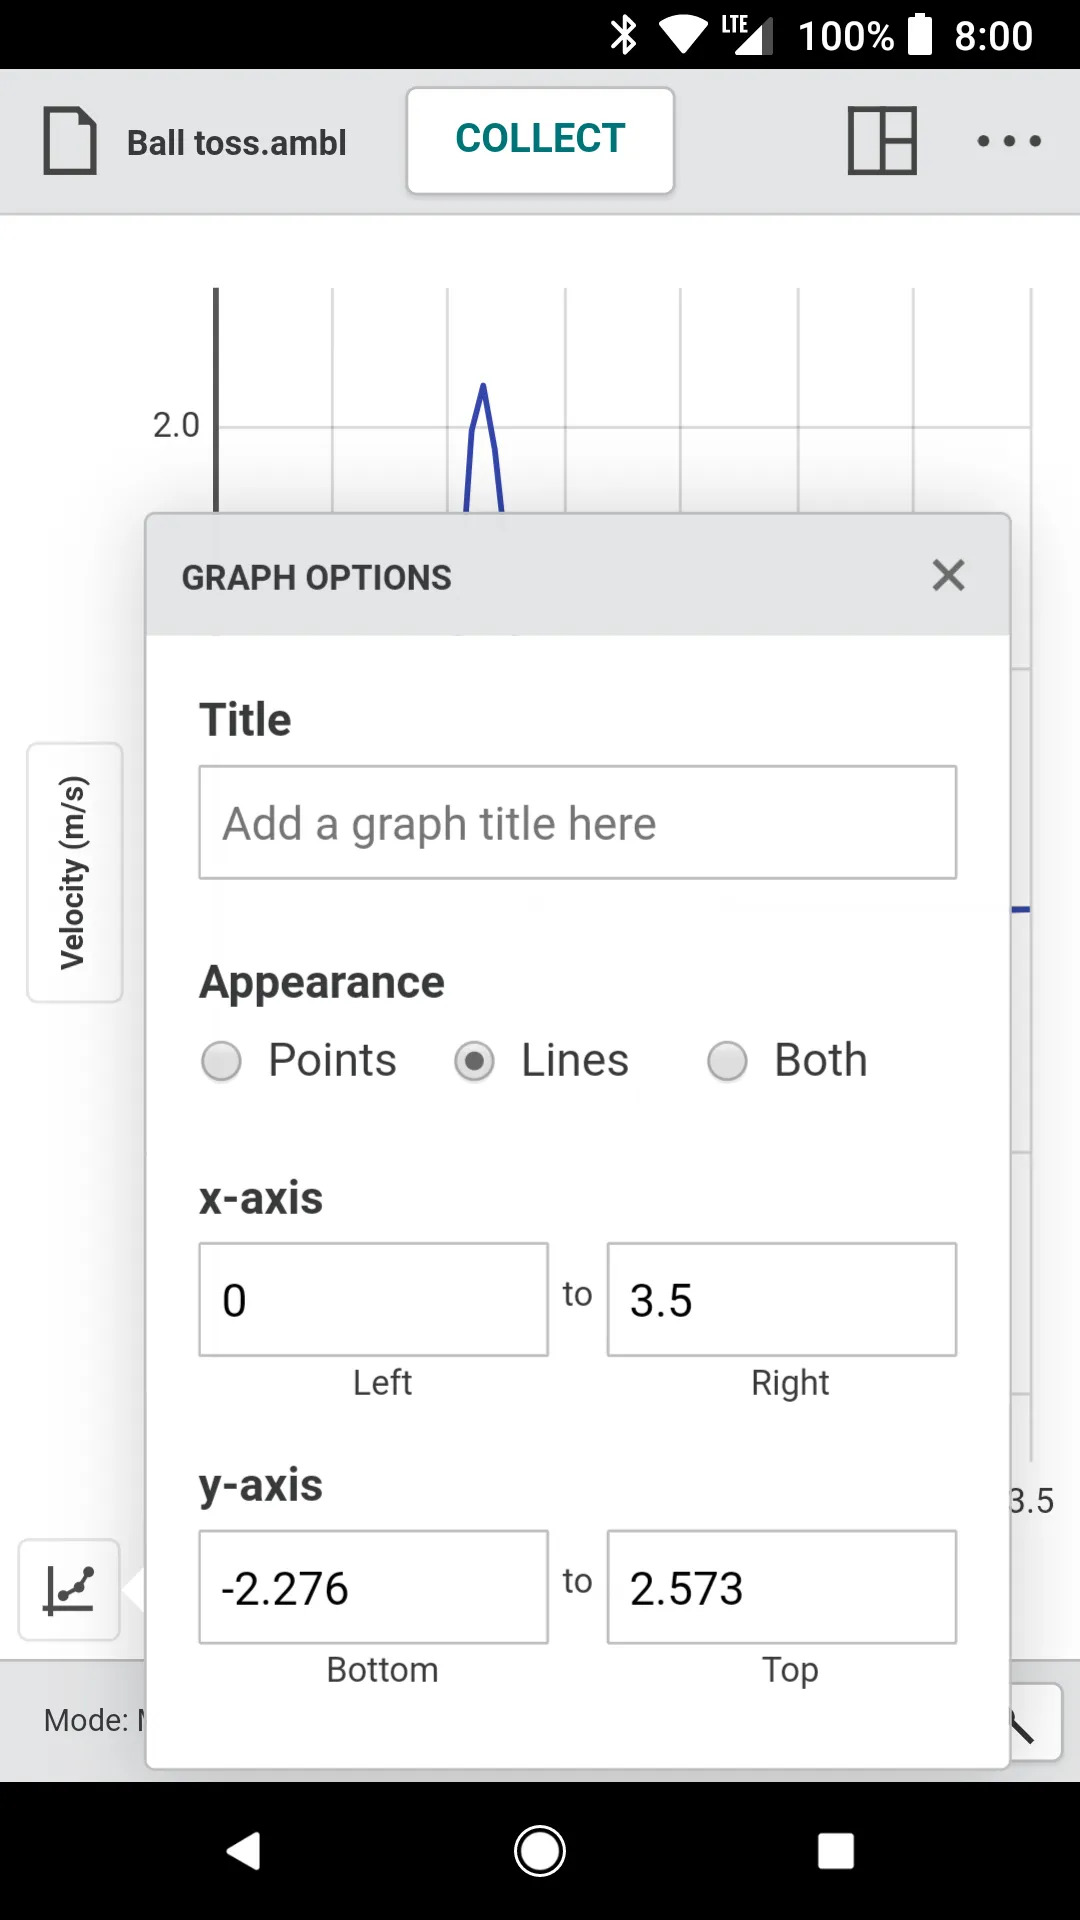
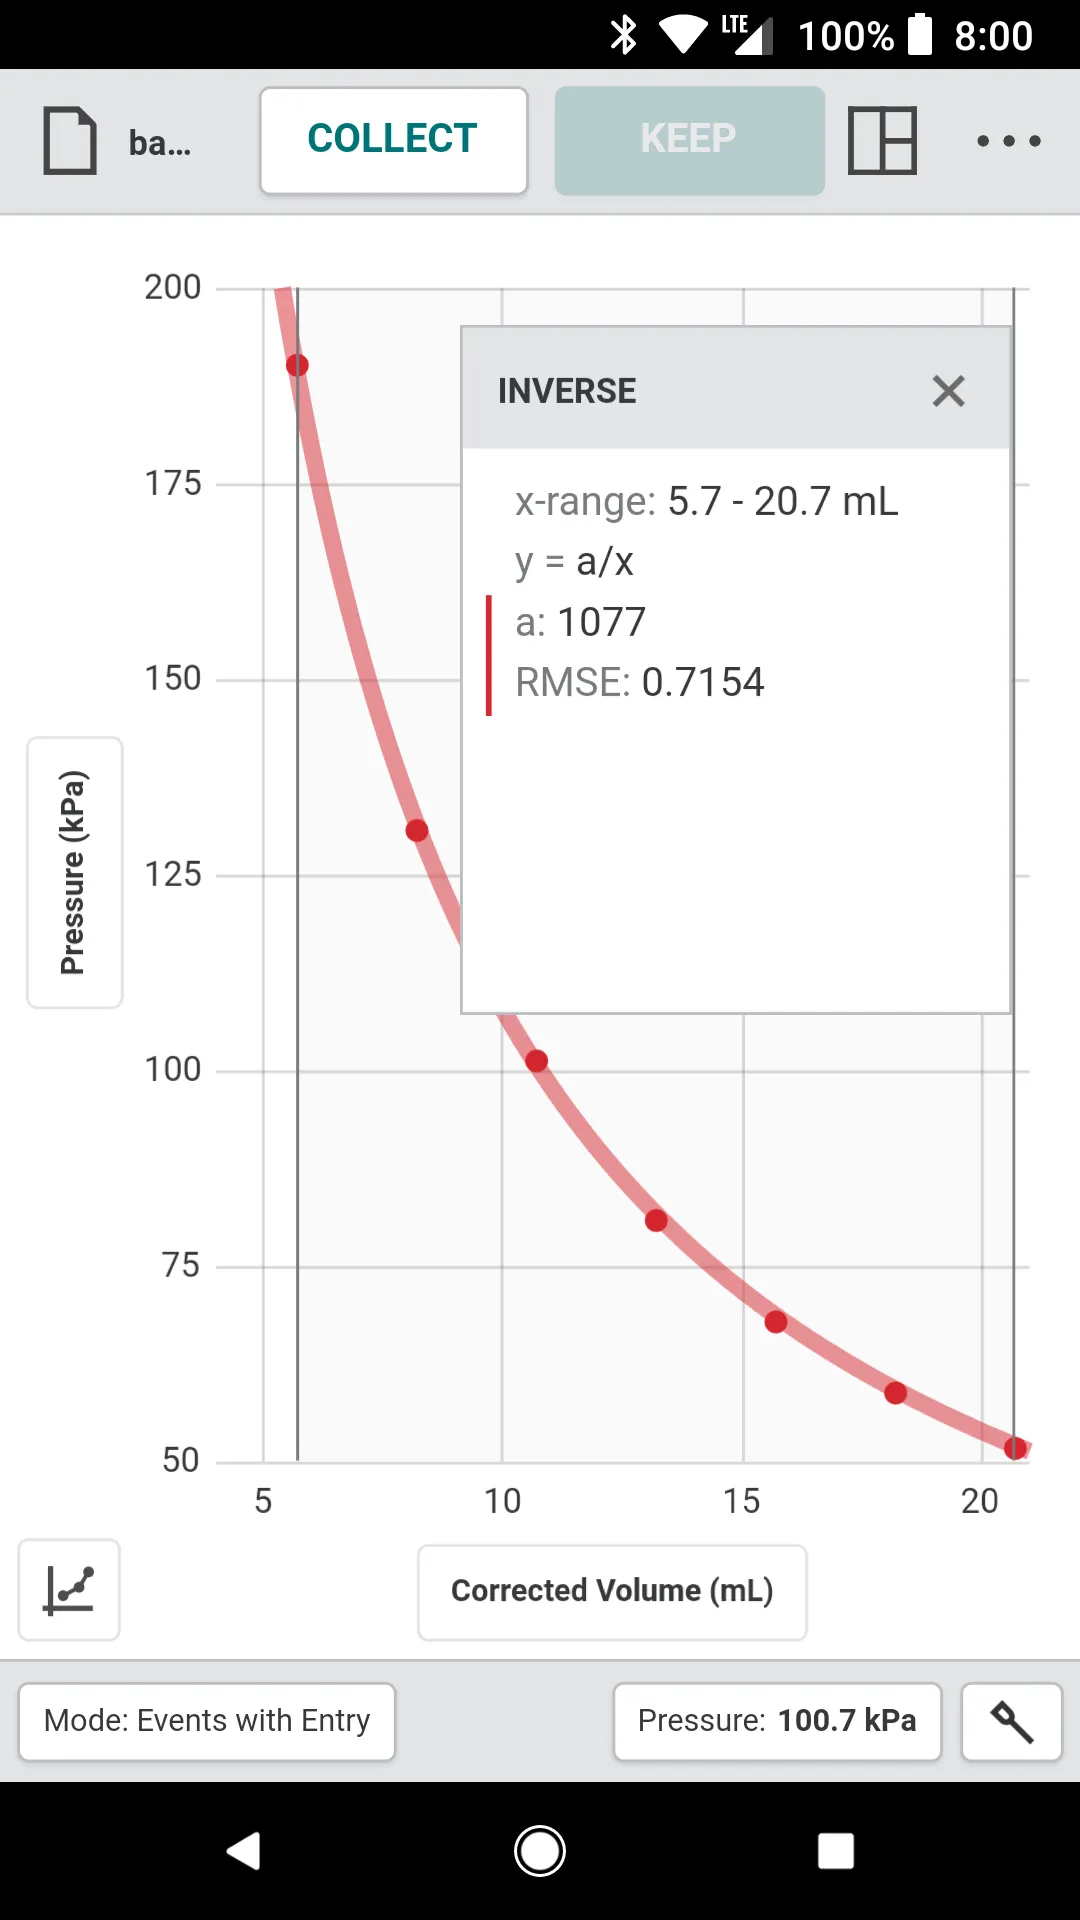
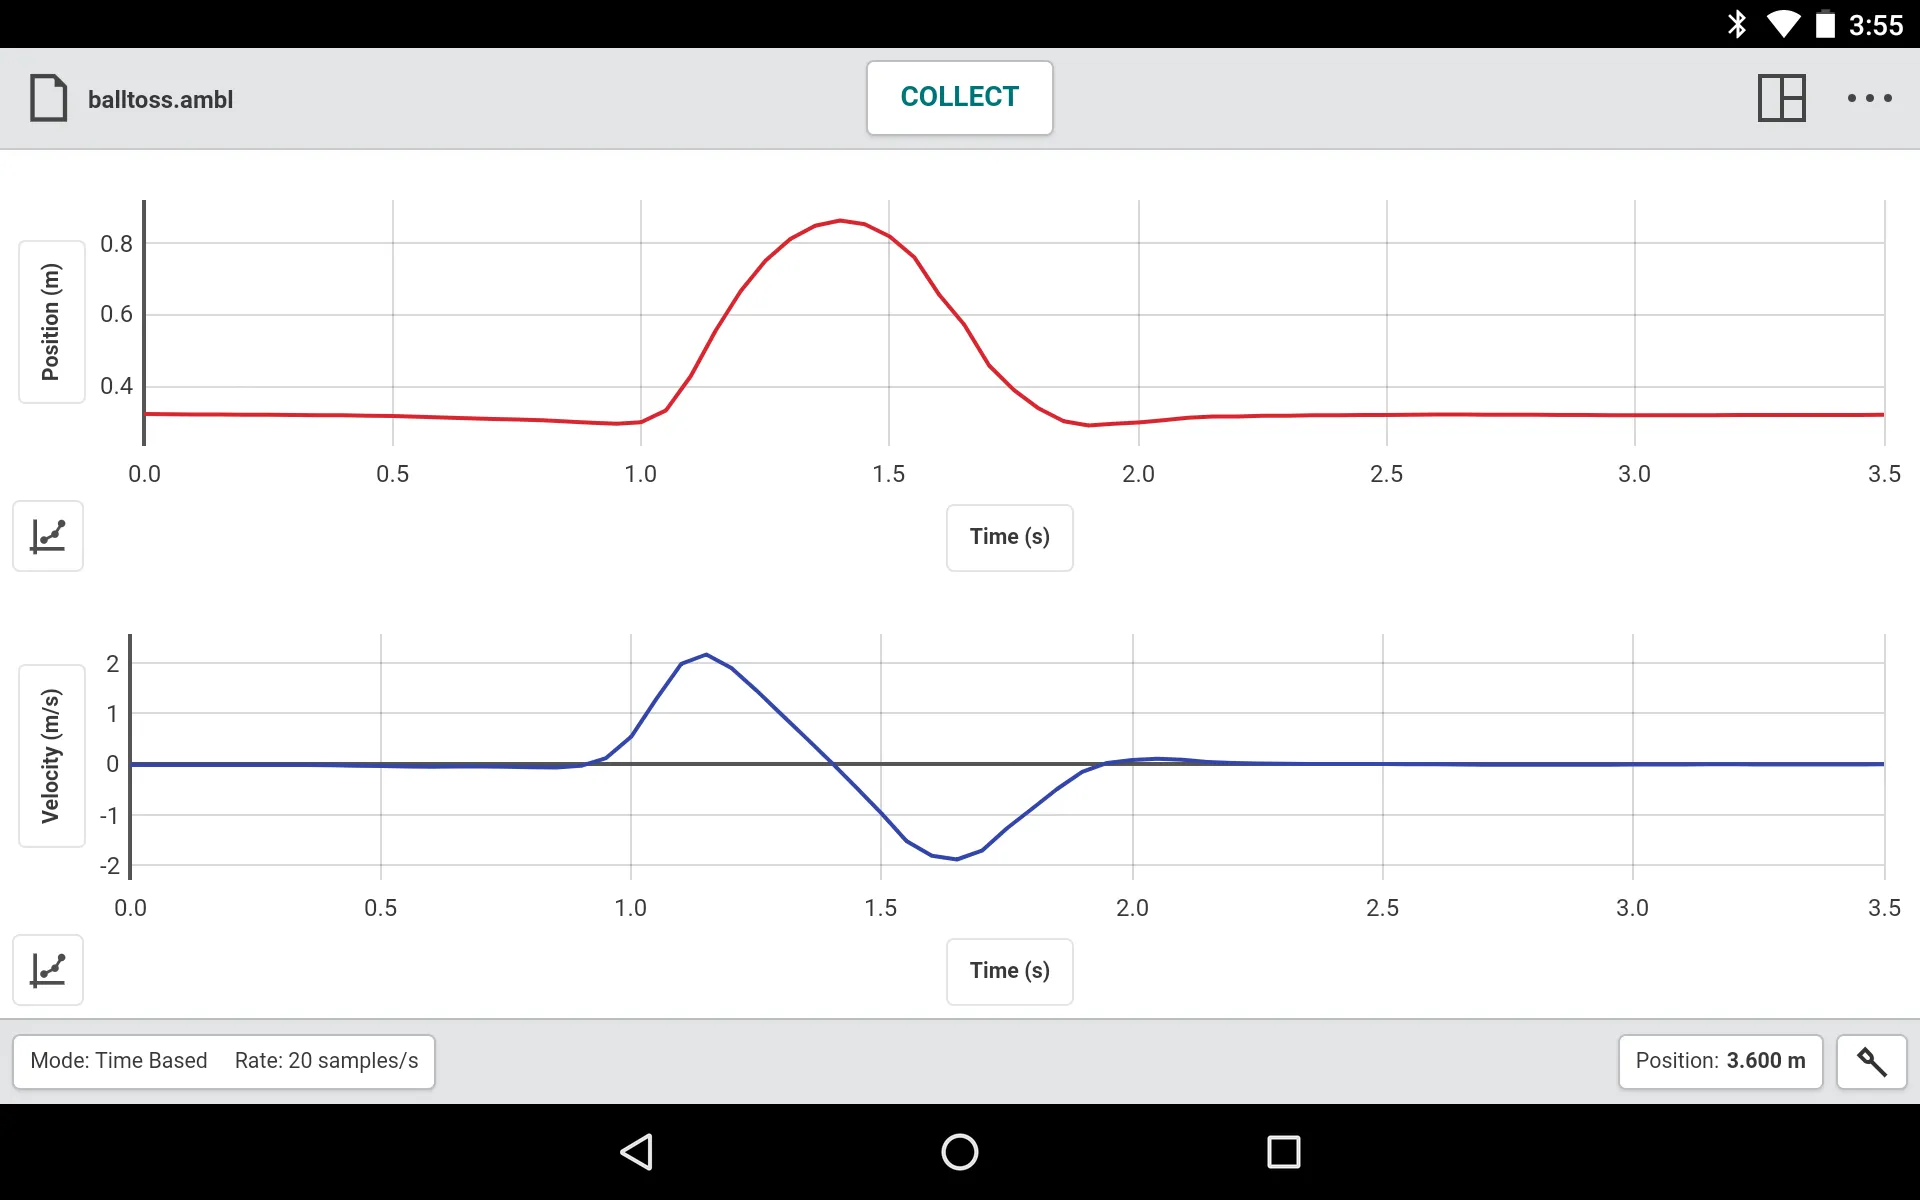
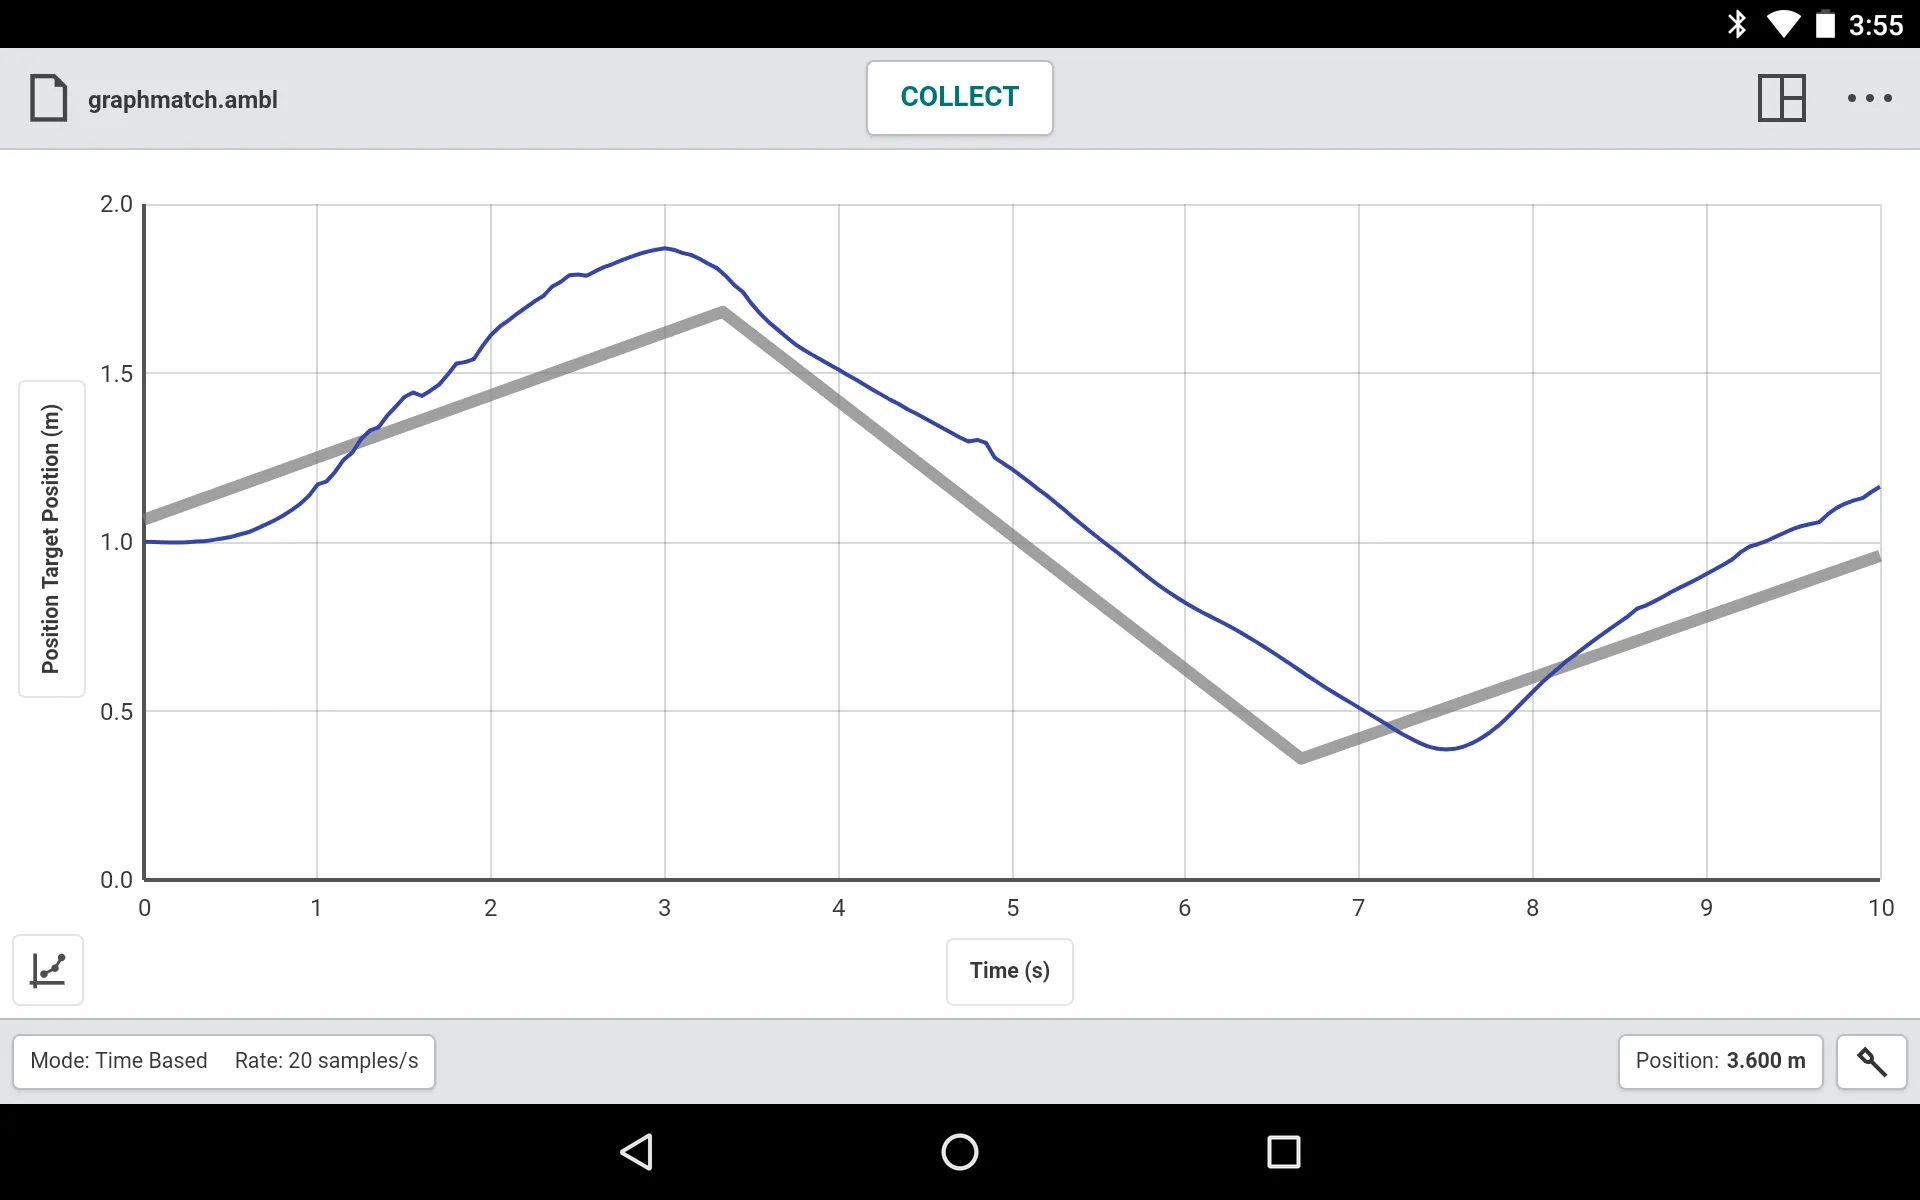
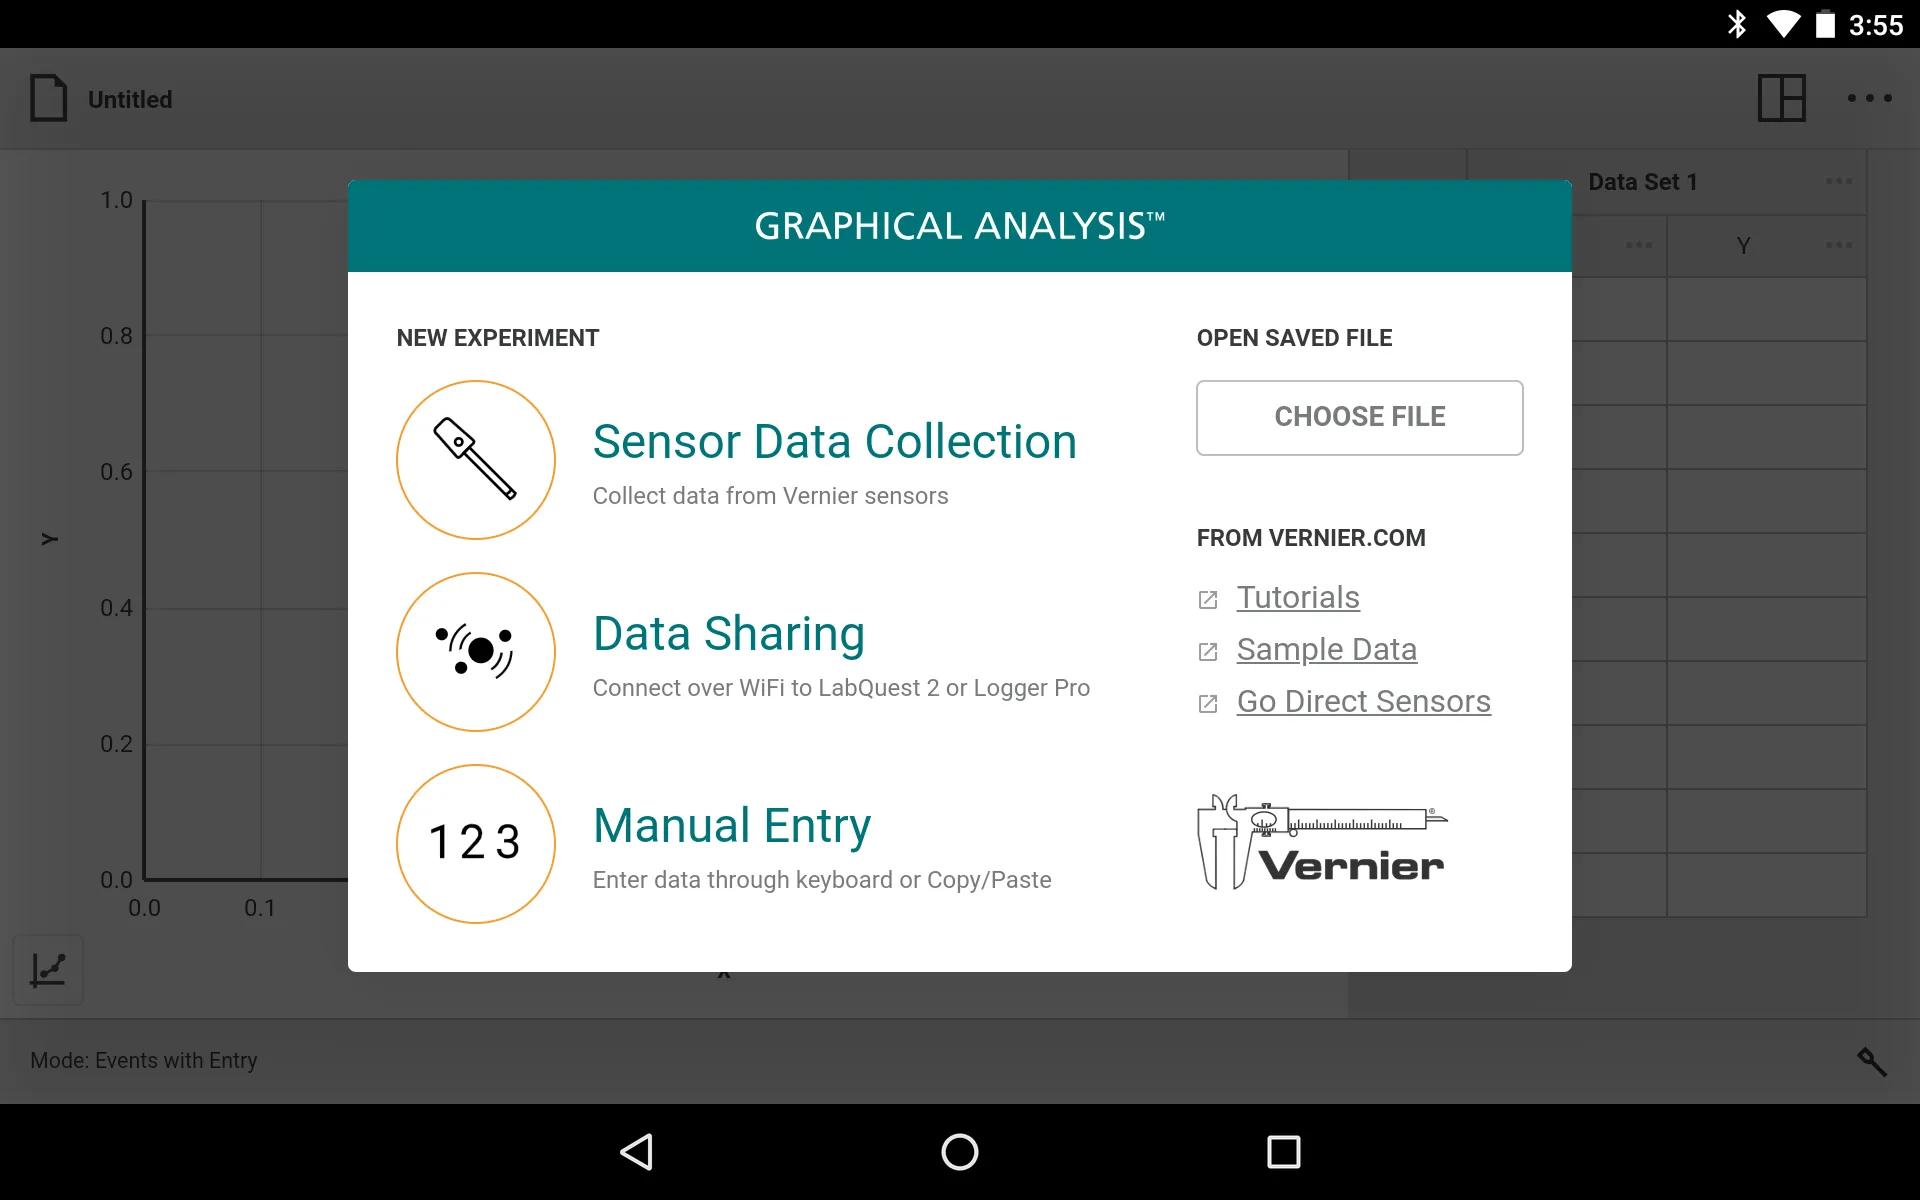
Graphical Analysis™ is a tool for science students to collect, graph, and analyze data from Vernier sensors. Sensor data-collection support: • Vernier Go Direct® sensors - with Bluetooth® wireless technology • Vernier Go Wireless® Heart Rate and Go Wireless Exercise Heart Rate monitors Additional experiment options: • Data Sharing via Wi-Fi connection to LabQuest 2, LabQuest 3 or Logger Pro® 3 • Manual Entry Note: Sensor data collection and Data Sharing require the purchase of hardware from V
Developer info